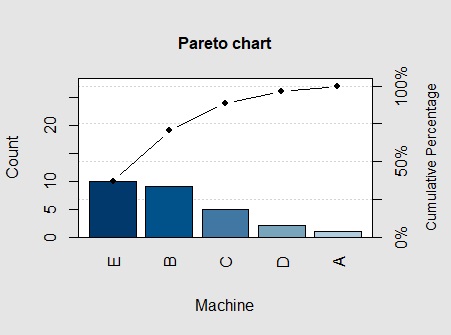
Data <-c (1,9,5,2,10)
names(Data) <- c("A","B","C","D","E")
pareto.chart(Data)
Pareto chart is not so difficult because it is a combination of a bar graph and a line graph, but it is a little difficult because it is not something that can be created quickly with EXCEL.
With R, you can make it quickly.
If you create it manually, you need to associate the order of the data with the name. The software sorts the data, so there is no need to sort the data in descending order.
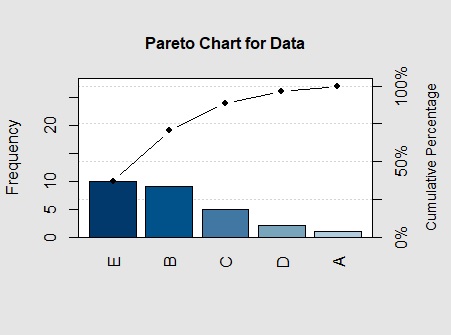
library(qcc)
Data <-c (1,9,5,2,10)
names(Data) <- c("A","B","C","D","E")
pareto.chart(Data)
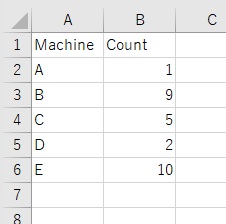
It is less troublesome to read the csv file.
The first column is the item name and the second column is the number. In the code below, the column name at the top is used as the name of the axis of the graph.
setwd("C:/Rtest")
Data <- read.csv("Data.csv", header=T)
Data2 <- as.vector(Data[,2])
names(Data2) <- as.vector(Data[,1])
pareto.chart(Data2,main ="Pareto chart", xlab = names(Data[1]), ylab = names(Data[2]))